We sent the same Playwright script to Etsy’s DataDome-protected search page 160 times. Going straight to the search URL, local Chromium and Browserbase failed all 60 of their runs on residential and datacenter IPs. Surfsky passed 20 of 20.
Short answer: to bypass DataDome with Playwright on Etsy, the browser mattered more than the IP. A homepage visit before the search lifted Browserbase to 95% on the free plan and 60% on the Developer plan; local Chromium still failed all 40 runs. Surfsky passed every run, cold and warm.
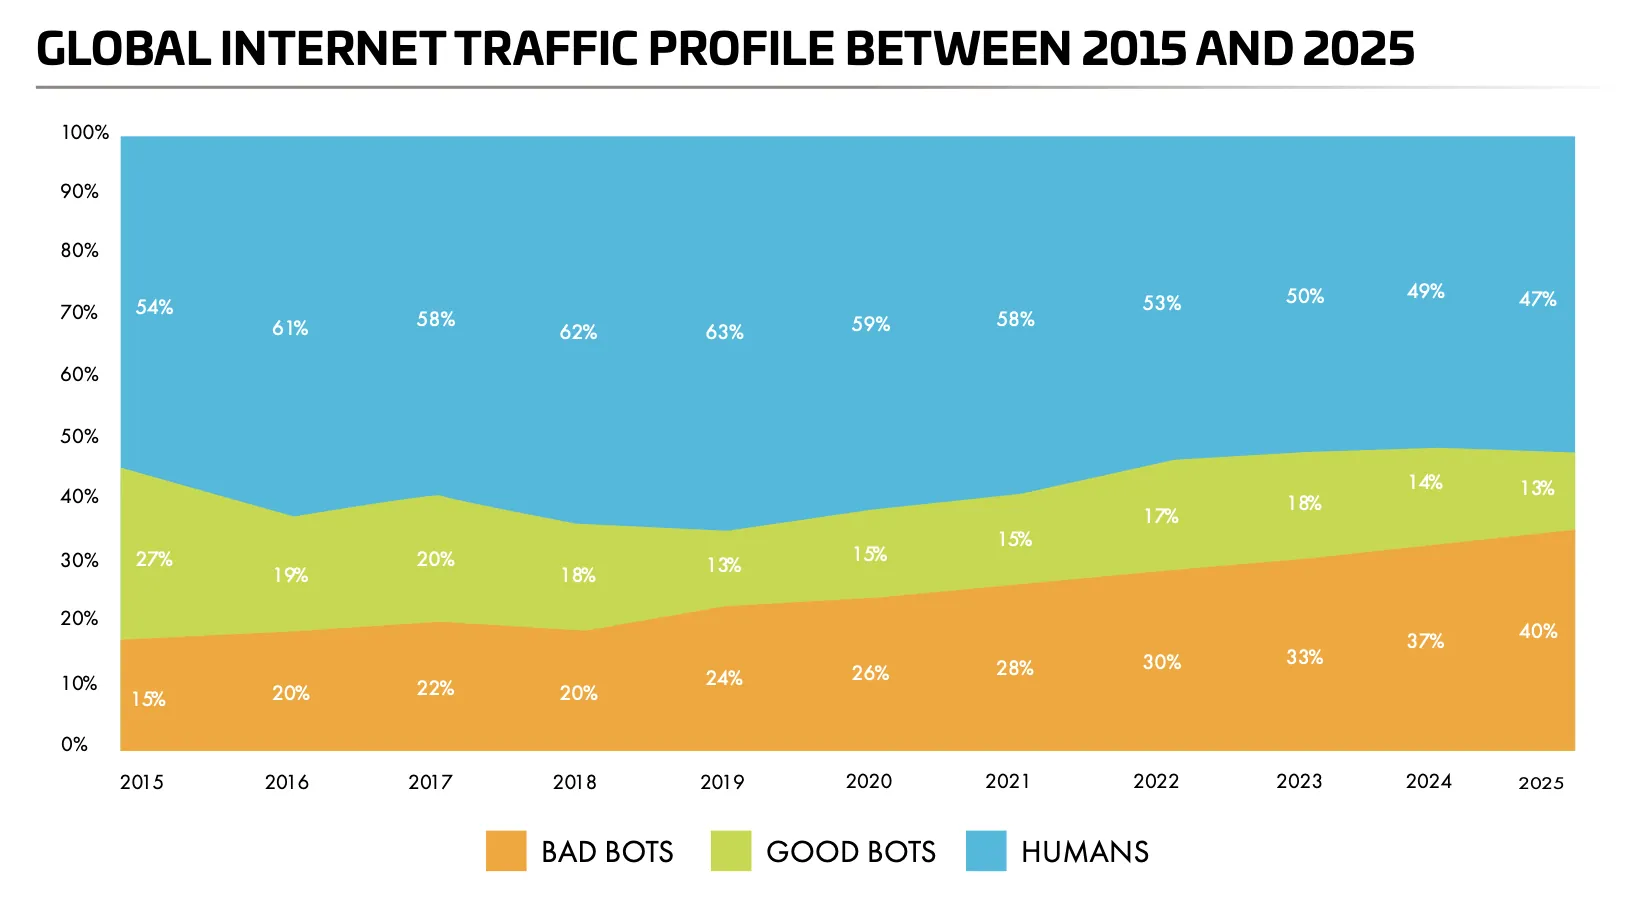
Bots made up 53% of all internet traffic in 2025, the second year running they outnumbered humans. Bad bots alone reached roughly 40%, the highest share Imperva has recorded (2026 Imperva Bad Bot Report). That’s why sites like Etsy put DataDome in front of their pages.
We ran the script against Etsy’s /search endpoint two ways on each backend: straight to the search URL (cold), and through the homepage first (warm).
Note: We have published everything from this test on GitHub, including the code, the raw CSVs for all 160 runs, and the screenshots. You can check our numbers or run the whole thing yourself by accessing this datadome benchmark repo.
Key Takeaways
- Cold runs: Surfsky passed 20 of 20. Local Chromium and Browserbase failed 60 of 60, on residential and AWS datacenter IPs alike.
- Warm runs: one homepage visit lifted Browserbase to 19 of 20 on the free plan. Surfsky passed 20 of 20.
- Local Chromium failed all 40 runs, cold and warm, on US residential proxies. Warm-up alone isn’t enough.
- Browserbase
advancedStealthis Enterprise-only, unavailable on the free and Developer plans. - Shelf life: Browserbase warm scored 19/20 on the free plan (AWS IPs, September 29) and 12/20 on the Developer plan (US residential, October 19).
Test Your Browser Stack for $5
Run your Playwright code through a real browser and see which requests pass.
- No card required
- API key in 30 seconds
- Change one line of code
Quick Results
| Backend | Cold (straight to search) | Warm (homepage first) | Median, warm |
|---|---|---|---|
| Local Chromium, US residential | 0/20 | 0/20 | 15,522 ms (blocked) |
| Browserbase Free, AWS IPs | 0/20 | 19/20 | 27,807 ms |
| Browserbase Developer, US residential | 0/20 | 12/20 | — |
| Surfsky, US residential | 20/20 | 20/20 | 23,142 ms |
How DataDome Detects Playwright: Network, Browser, Session
According to DataDome, its system makes a blocking decision in under 2 milliseconds. In that window it checks three ordered layers to tell a human from a safe bot, like a search crawler, or a harmful one:
- Network
- Browser
- Session
Network layer: Transport Layer Security (TLS) fingerprints
When a client connects over HTTPS, it provides a combination of metadata about the security algorithms it can or cannot support. This information is shared during a process called the TLS handshake.
During this handshake, the client (browser, app, etc.) and the server have to agree on a combination of cipher suites and extensions that both parties support. The server side then hashes the values received from this combination, and that hash value is called the TLS fingerprint.
The most well-known format used for TLS fingerprinting is JA3. JA4 is its modern and harder-to-spoof successor.
DataDome uses machine learning models to analyze TLS fingerprints and identify malicious ones within them. The following things about a TLS fingerprint are analyzed:
- The percentage of bots that have had the same fingerprint in the past
- Quality of IPs the fingerprint carries
- The associated Operating system (OS)
- Browser name and version
DataDome has observed two types of patterns that often exist in malicious traffic:
- The TLS fingerprint is unique from any other fingerprint in the traffic, making it stand out and implying that it was programmed/forged.
- The fingerprint values are inconsistent with device values.
Browser layer: device and rendering fingerprints
Once a request has proven to be a real browser’s TLS/HTTP stack, it passes the network layer.
Next, DataDome starts fingerprinting the browser environment itself.
This fingerprint is comprised of the following signals:
- Canvas rendering output
- WebGL parameters
- Installed fonts
- Screen resolution
- Timezone
- Audio signals
- Flags like
navigator.webdriver
When a website or app visitor is genuine, these signals are consistent.
But when there’s automation or spoofing involved, these signals are often inconsistent because each of those values often gets set independently, by different tools or different configuration steps, without anything enforcing that they describe the same machine.
For example, if a user-agent string claims to be Chrome on macOS but the font list associated with the fingerprint is one that only exists on Windows installations, that’s an inconsistency.
The individual values such as Chrome browser, macOS device, and the Windows font list aren’t suspicious on their own. But their combination doesn’t correspond to a device that exists, so it’s flagged as suspicious.
Session layer: behavior and the trust score
After the browser fingerprint checks, DataDome starts monitoring the visitor’s behavior during the session.
This includes the following:
- Mouse movements
- Touch events
- Scrolling
- Request speed and velocity
- How deep the visitor explores
- Typing speed
DataDome uses machine learning models trained on genuine human and bot sessions to evaluate whether these patterns are human or bot-like.
For example, if a visitor is making far more requests in a short time, that’s unlikely to be a human. Or if a visitor’s mouse movements are too linear, that’s also most likely a bot.
This is done through DataDome’s product “Bot Protect.”
Session history matters here as well. A visit that directly opens a search results page without any prior activity on the site looks different to DataDome from one who arrived at the homepage first and then searched. For Browserbase, this turned out to be the single biggest factor in our test.
The tool also offers another service called Agent Trust that is designed to monitor good bots or trusted AI agents, e.g., LLM crawlers, customer-authorized shopping assistants, etc.
Agent Trust monitors the activity of AI agents and updates their trust score in real time. The admin of the site can change the permissions (allow or block) of an AI agent at any time based on the insights provided by Agent Trust.
Why We Left Patched Browsers and Scraping APIs Out
Two other tool categories were left out on purpose: patched open-source browsers and URL-in, HTML-out APIs.
Patched open-source browsers
Patched open-source browsers include tools like Nodriver, SeleniumBase CDP mode, Camoufox, etc.
These didn’t make it into our test because you have to build and maintain them yourself. The burden of maintaining a patched browser, as well as both the browser engine and DataDome’s model updates, would have been too much.
And that burden can get worse. For example, Camoufox’s own primary maintainer announced in March 2025 that a medical emergency had taken him offline. That event stalled the project’s updates for months. The maintenance responsibility had to be handed to a different team eventually.
That’s why we didn’t find it fair to benchmark a tool whose patches can go stale for months at a stretch alongside a paid service that’s actively maintained on a predictable schedule.
URL-in, HTML-out APIs
There are also tools like Scrapfly and ScraperAPI that return a rendered HTML when you send them a URL. They handle the anti-bot system on their own behind the scenes.
The reason why these weren’t included is that with these tools, there’s no session to hold open and send commands like click this, wait for that, fill this form, navigate to the next page, etc.
Since there’s no live browser instance on your side of the connection in these tools, they are a poor fit for a test that depends on holding a Playwright-controlled session across multiple actions.
Playwright vs Browserbase vs Surfsky Test Methodology
Target and task
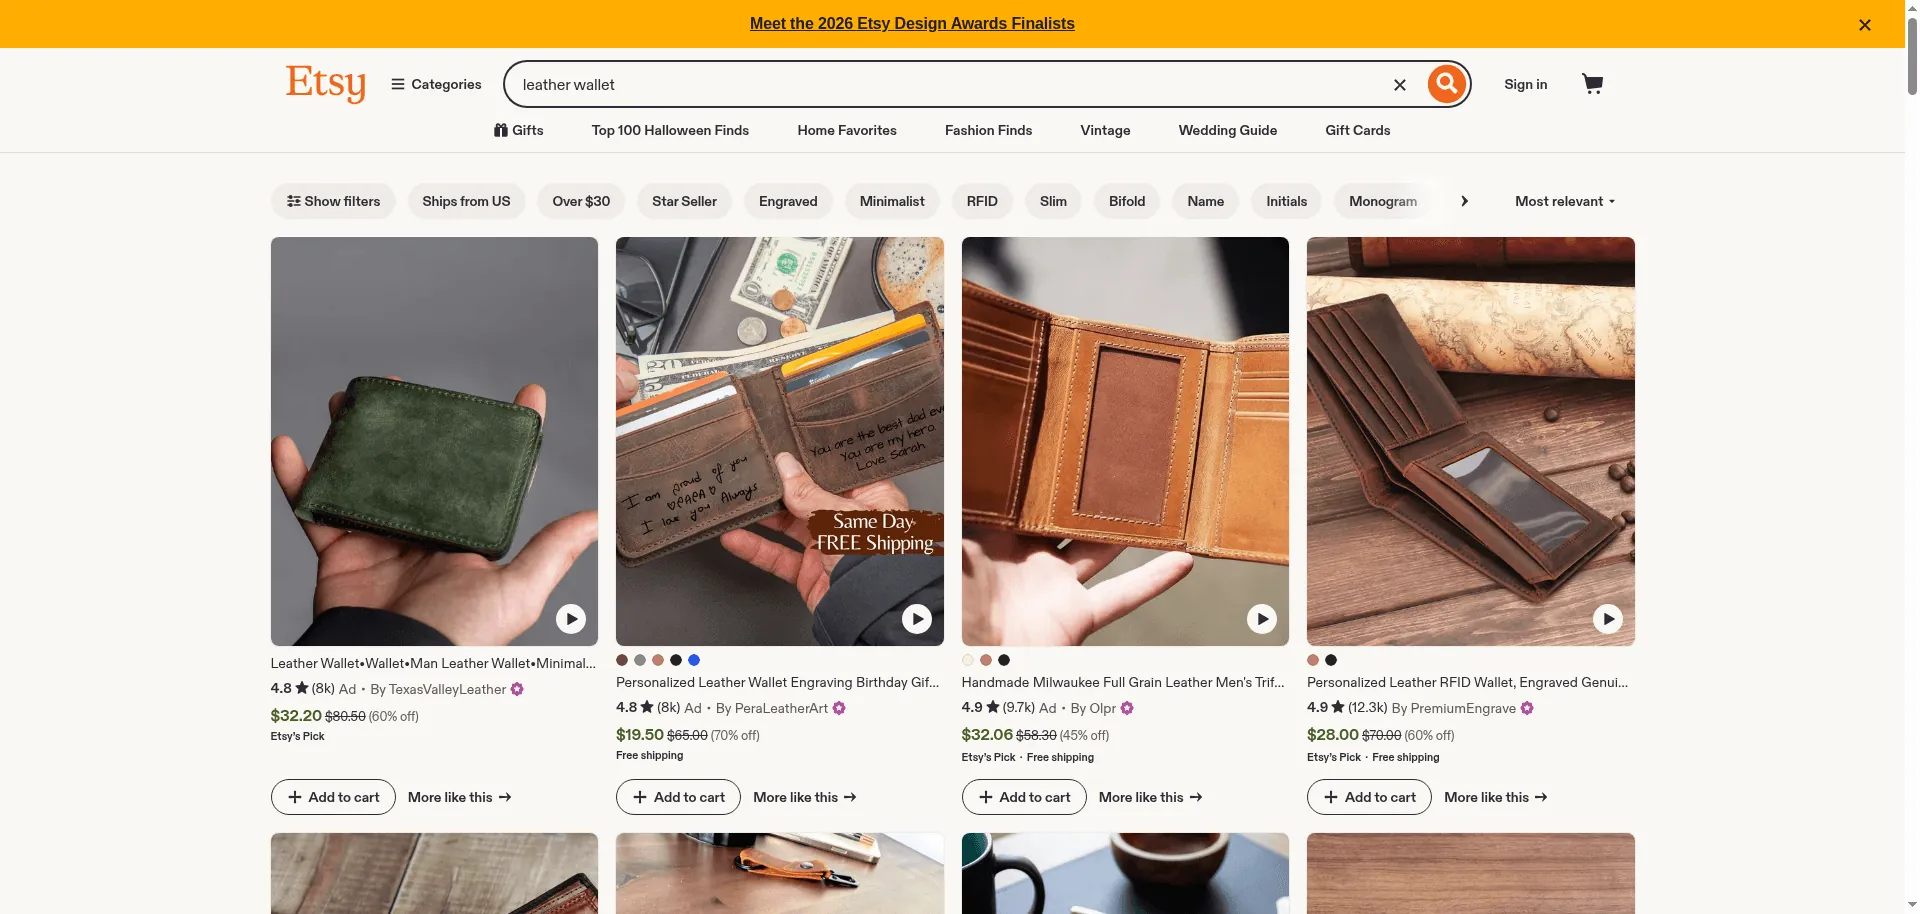
The target is Etsy’s /search endpoint: https://www.etsy.com/search?q=leather+wallet
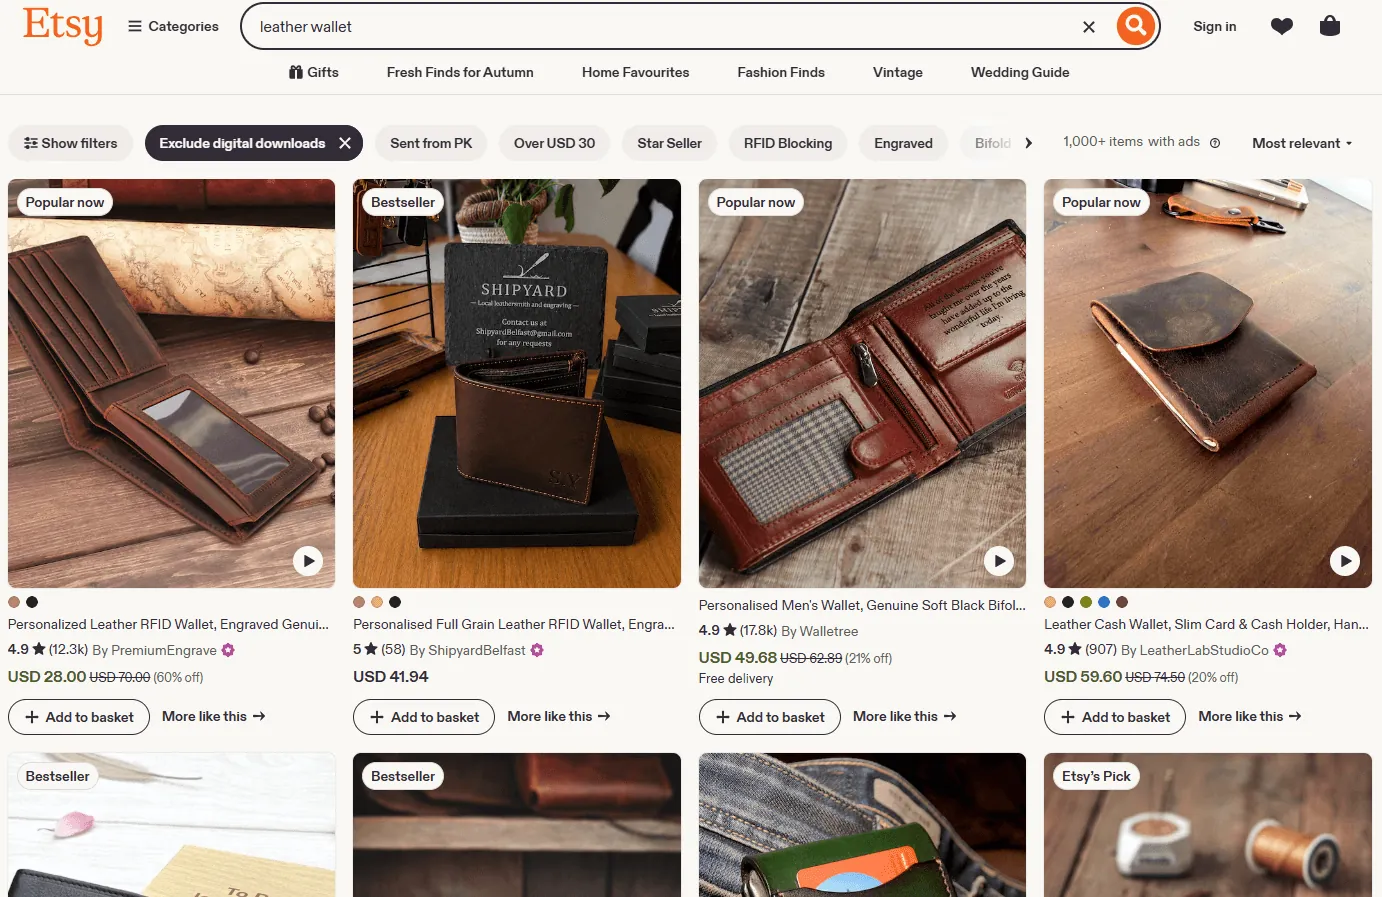
We chose Etsy after confirming that it uses DataDome for protection against malicious traffic by checking for the DataDome cookie in an unmodified browser session.
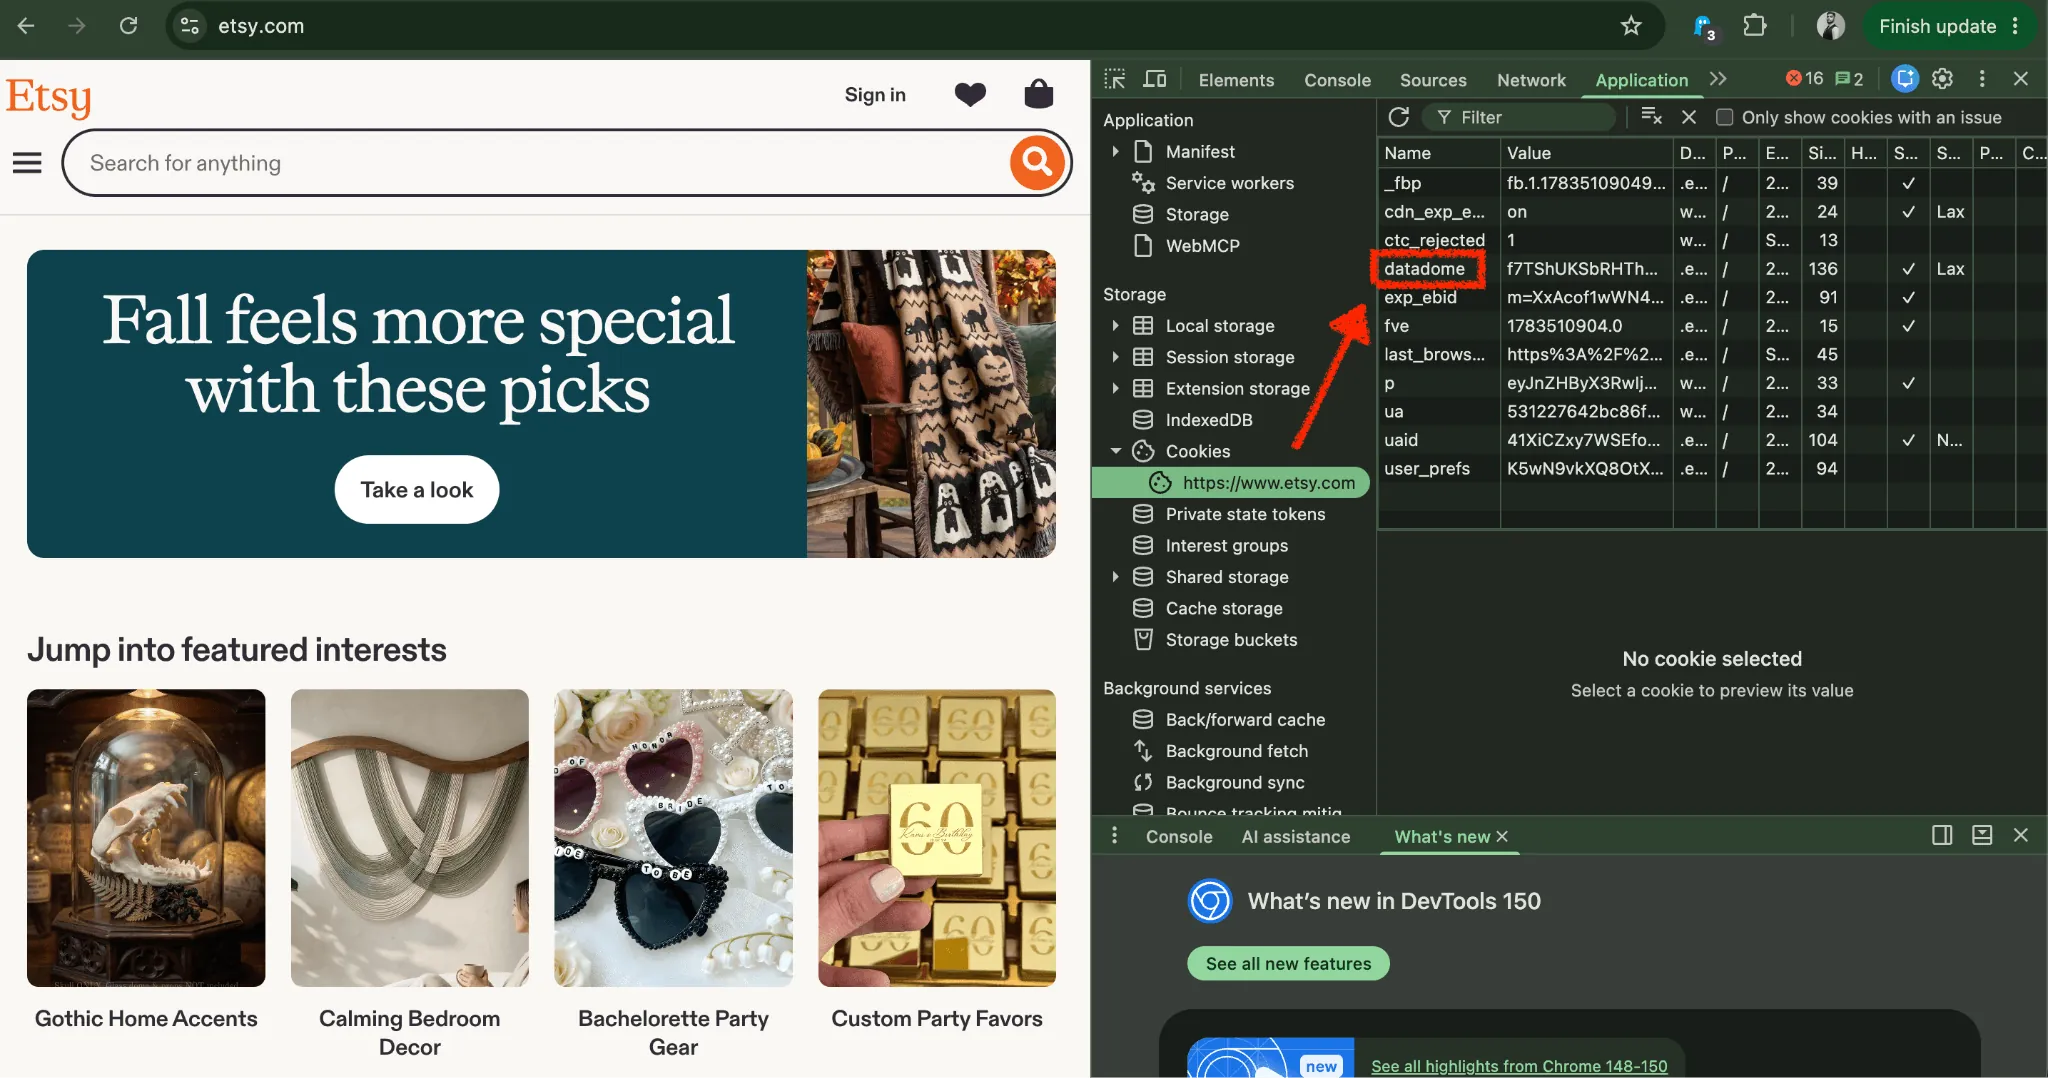
DataDome sets this cookie on protected sites to track a session’s trust score over time.
We also made sure that DataDome was consistently enforced across different paths on Etsy. Otherwise, we could have picked whichever page happened to be the weakest link to show that every backend can easily bypass DataDome.
So, /search wasn’t the most weakly guarded page. It was uniformly guarded like other Etsy pages.
The search endpoint is also a realistic target because anybody scraping Etsy will be querying search results repeatedly, not, for example, the homepage.
Another reason we are being explicit about the target site is that DataDome trains a separate detection model for every protected site. So this test isn’t trying to make a claim about DataDome in general. Don’t take it as a generic “how to bypass DataDome” guide.
What counts as a pass
A request that clears the following three conditions will be counted as a pass:
- The request returns an HTTP status code 200
- The response HTML should not contain challenge scripts, a CAPTCHA-delivery iframe, DataDome’s own challenge JavaScript, and other challenge markers.
- The response HTML contains the content of a successfully loaded Etsy search results grid.
A request must clear all three of these conditions. None of them alone is sufficient.
The second condition is more important than it looks on the surface here. DataDome often returns a 200 with a challenge page behind it instead of a 403.
Sample size and run schedule
The three backends (local, Browserbase and Surfsky) run in batches between September 29 and October 22, with 45 seconds between runs.
Each backend configuration ran 40 times, split into two arms of 20:
- Cold: the script goes straight to the search URL
- Warm: the script loads the Etsy homepage first, waits 5 seconds, then goes to the same search URL
We tested two navigation patterns because how a session arrives at a page is a signal in its own right, separate from what the browser looks like. Splitting the runs this way lets us see how much of the outcome comes from the backend and how much comes from the path taken to get there.
Everything else is identical between the two arms. We used the same target URL, selectors, timeouts, and pass conditions. The only difference between cold and warm setups was the homepage visit.
Runs in each batch were spaced 45 seconds apart. If we had run them back to back, it would have been a detection signal on its own, and we would have ended up measuring our own traffic pattern instead of the backends.
Here are the limits of this test:
- One target: The results of this test describe performance against Etsy’s DataDome model only. The test shouldn’t be taken as a representative of performance against DataDome in general.
- One date range: DataDome’s detection models get retrained and adjusted over time. So a result from this test window is not a permanent guarantee that the same setup will behave the same months later.
- One geography: We used US proxies throughout the testing. So using a different location might yield different results because DataDome’s scoring can factor in signals tied to network origin.
Run 1: Local Playwright Chromium on a Residential Proxy
In this run, we launched local Chromium using Playwright with a sticky US residential proxy and left navigator.webdriver to true on purpose.
The point of using a stock headless Chromium was to establish how a low-effort solution performs against Etsy’s DataDome anti-bot protection. It was done so that we have a baseline to measure the output of the other two arms, Browserbase and Surfsky, against.
Here’s the launch configuration:
# three US residential exits, rotated deterministically, one per run
proxy = PROXIES[(n - 1) % len(PROXIES)]
browser = await pw.chromium.launch(headless=True, proxy=proxy)
ctx = await browser.new_context()
page = await ctx.new_page()
page.set_default_timeout(60000)
We rotated deterministically across three US residential exits, one per run, so each run held a single IP for its whole session and no single IP carried more than a third of the traffic. The exit city is logged per run in the CSV.
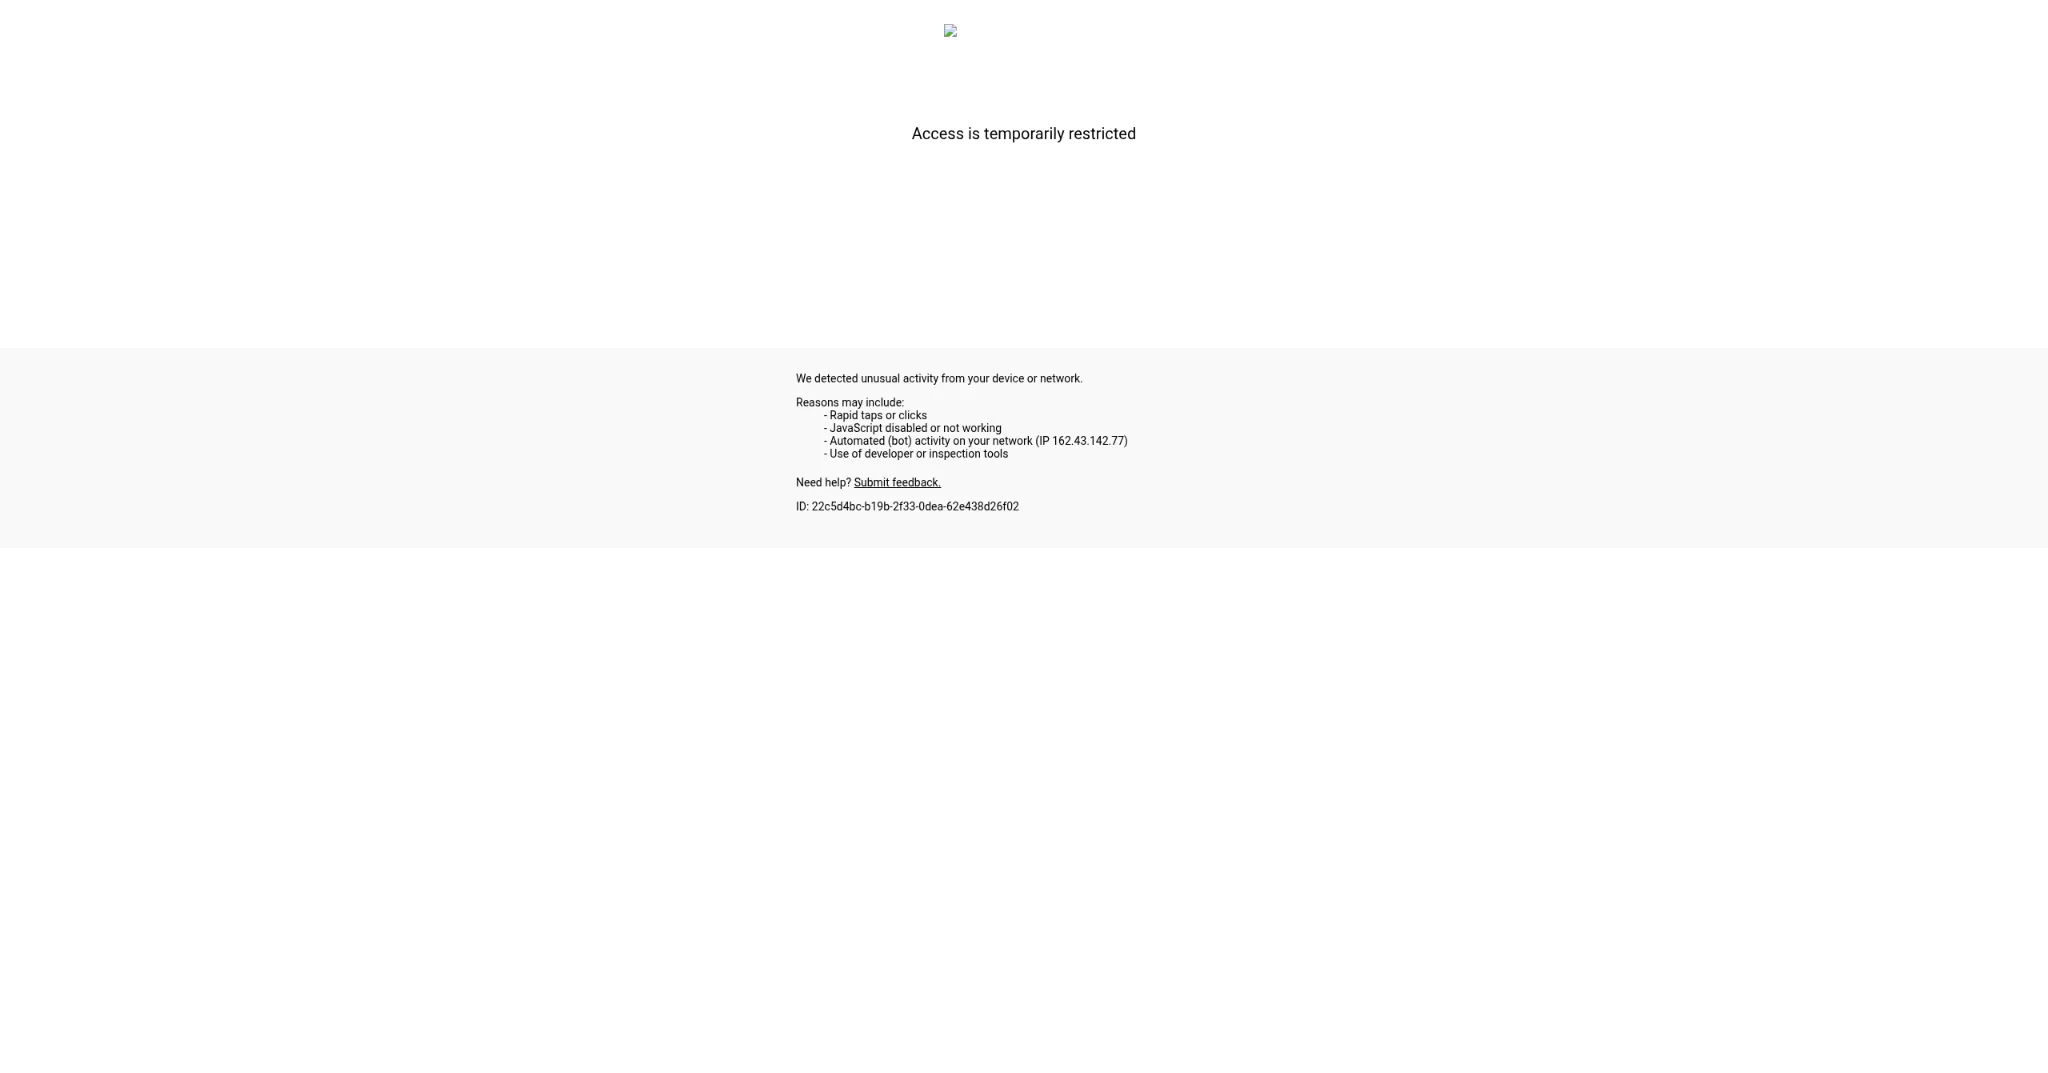
We then ran 40 runs with local Chromium, but it couldn’t pass a single run. Runs were blocked by DataDome with the following things in the response body:
- HTTP 403
geo.captcha-delivery.comvar dd=
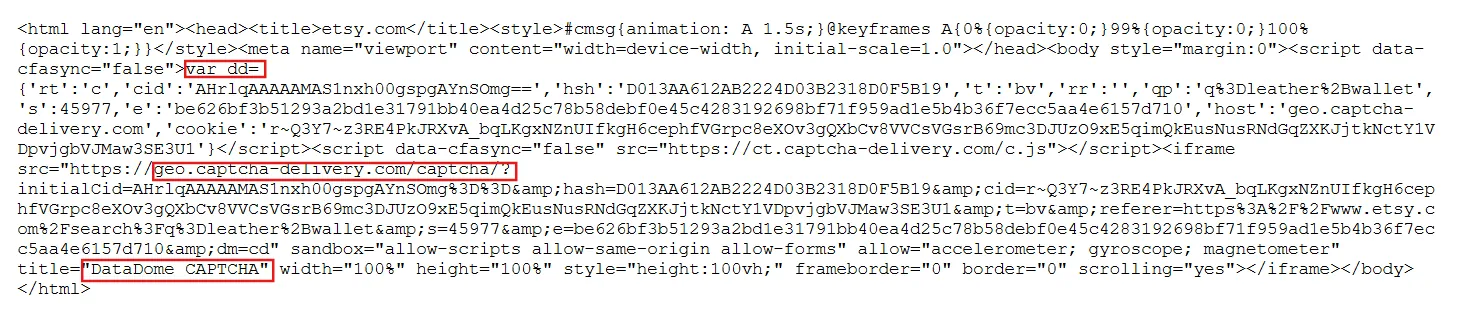
There were zero bytes of listing content in the response.
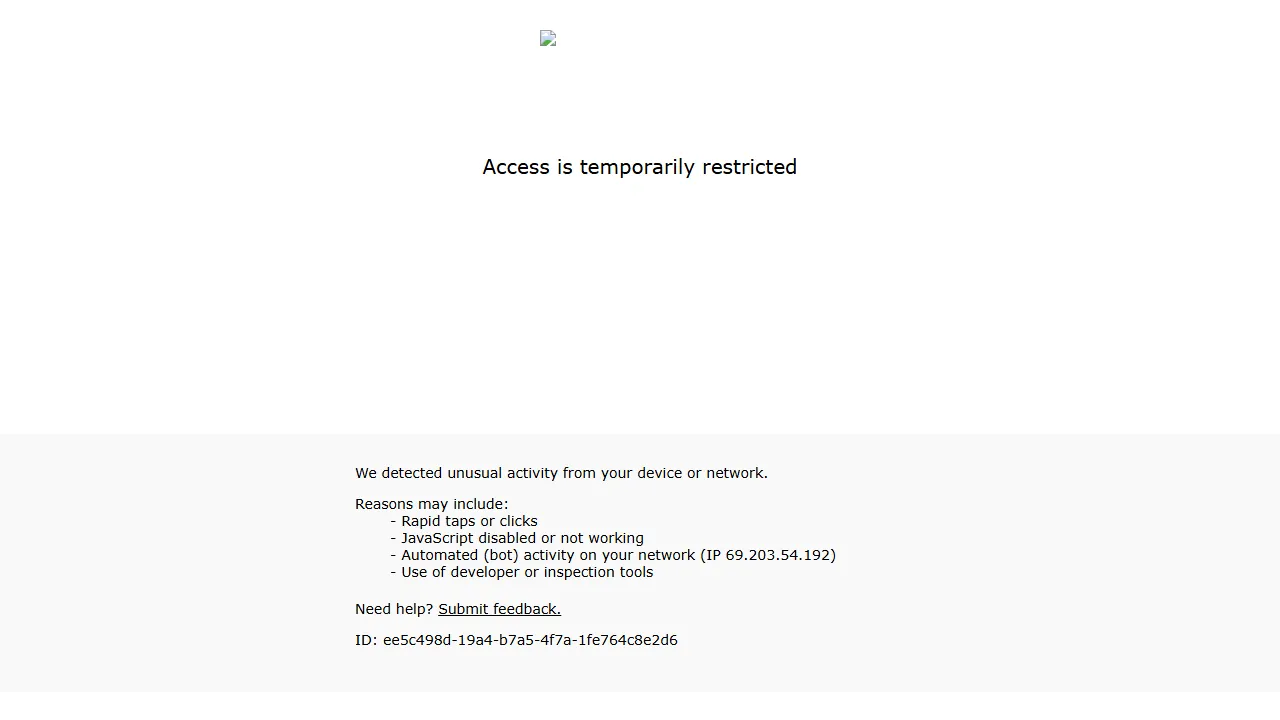
Also, the warm-up didn’t rescue this backend either.
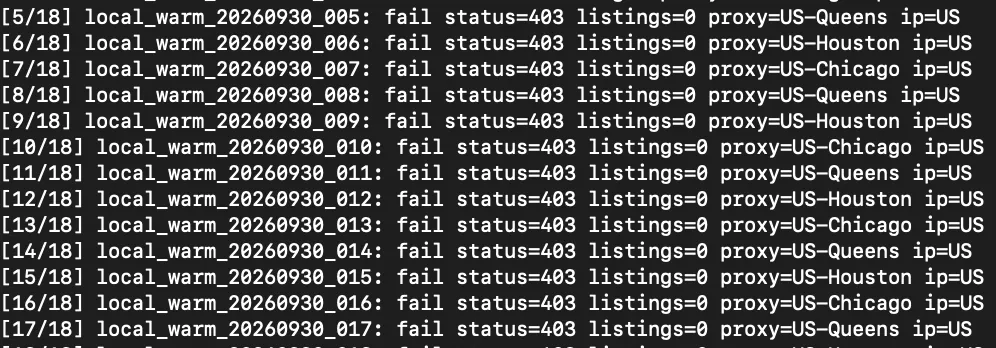
All 40 runs were blocked. That’s expected against DataDome when navigator.webdriver is reporting true and no fingerprinting work has been done.
That aside, local Chromium was the quickest of the three backends:
- Median total run time, cold: 10,230 ms
- Median total run time, warm: 15,522 ms
The speed is misleading. DataDome’s block page is about 1,500 bytes; a real Etsy results page is closer to 1.5 MB. Local Chromium was fast because it never loaded a real page.
Run 2: Browserbase over CDP, Free and Developer Plans
We created a cloud-hosted Chromium session through Browserbase’s own SDK. Playwright connected to that session over CDP.
def create_session(retries=4):
    body = dict({"projectId": PROJECT_ID}, **SESSION_EXTRA)
    for i in range(retries):
        req = urllib.request.Request(
            "https://api.browserbase.com/v1/sessions",
            data=json.dumps(body).encode(),
            headers={"X-BB-API-Key": API_KEY,
                     "Content-Type": "application/json"},
            method="POST")
        try:
            return json.loads(urllib.request.urlopen(req, timeout=60).read())
        except urllib.error.HTTPError:
            raise                      # real API rejection, don't retry
        except urllib.error.URLError:
            time.sleep(3 * (i + 1))    # transient network failure, retry

sess = create_session()
browser = await pw.chromium.connect_over_cdp(sess["connectUrl"], timeout=90_000)
We used a Browserbase free tier account. On the free tier, there are no proxies available, and you can’t configure your own either. Asking for proxies on a free Browserbase plan returns a 402, and asking for their advanced Stealth setting returns a 403.
On the Developer plan, proxies work, including US geo-pinning. But advancedStealth still returns the same 403. It isn’t available on Developer either.
So neither of our runs had Browserbase’s hardened stealth. Both ran on whatever baseline anti-detection their managed browser applies by default.
{"statusCode":402,"error":"Payment Required","message":"Proxies are not included in the free plan."}
{"statusCode":403,"error":"Forbidden","message":"Verified mode is only available on the Enterprise plan"}
Free plan, no proxies (September 29)
With no proxies available on the free plan, every session exited through Browserbase’s own infrastructure, which is AWS.
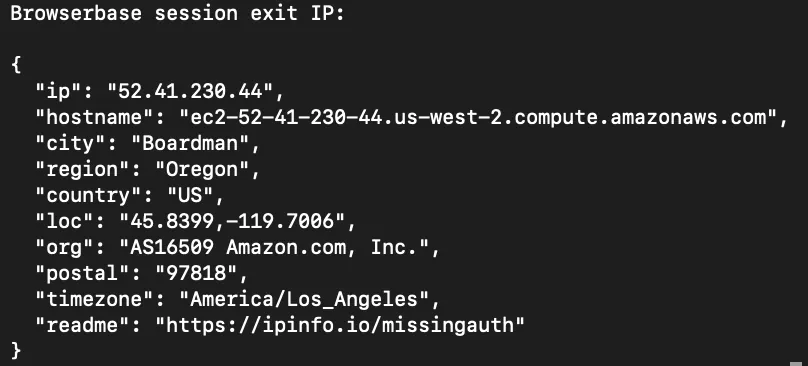
- Cold: On cold setup, Browserbase could not pass any of the sessions, meaning 0 passes out of 20. All of them were blocked with a 403 and the usual DataDome challenge markers in the body. Out of these 20 runs, one of them gave a CAPTCHA before blocking.

- Warm: On warm setup, Browserbase was successful in passing 19 out of 20. The one session that failed was a connection error, and not a DataDome block, so on completed runs it was 19 out of 19.
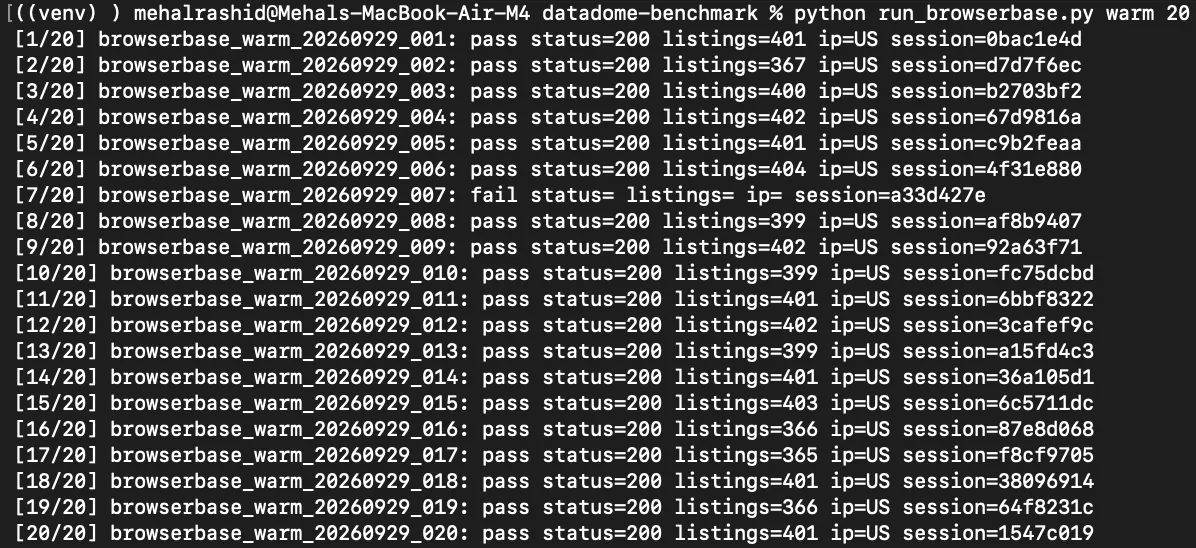
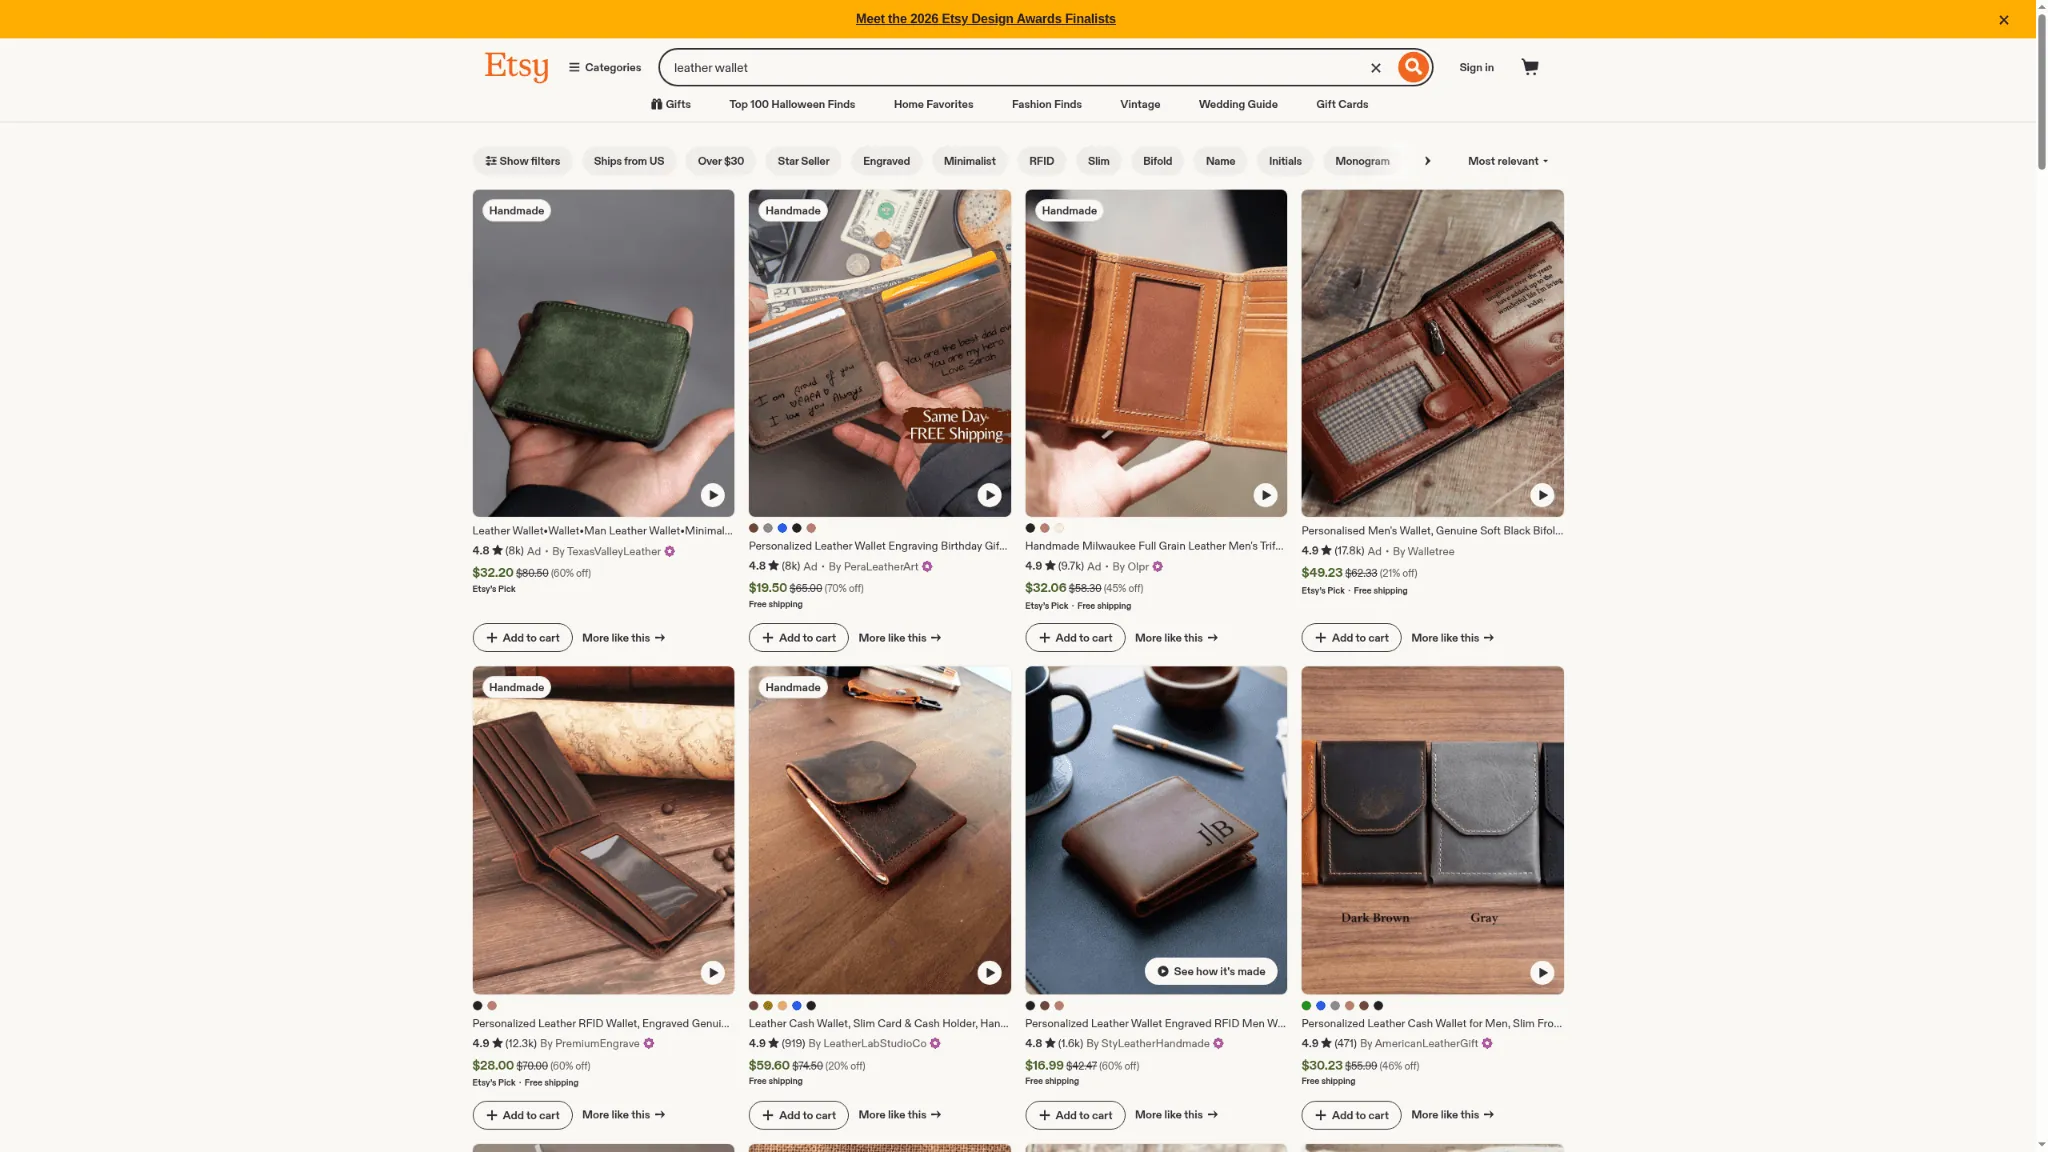
Every passing run returned between 365 and 404 listing hits in the response HTML, which is a fully rendered search results page.
However, operationally, Browserbase was the slowest of the three backends that we tested:
- Median total run time, cold: 15,575 ms
- Median total run time, warm: 27,807 ms
We’re reporting medians rather than averages here. A handful of Browserbase runs took well over two minutes, which pulled the warm average up to 41,152 ms against a median of 27,807 ms. Those were session creation delays on a free tier account with a concurrency cap.
Developer plan, US residential proxies (October 19)
We re-ran both arms on a paid Developer plan as well with residential proxies pinned to US exits. These were the exact session flags:
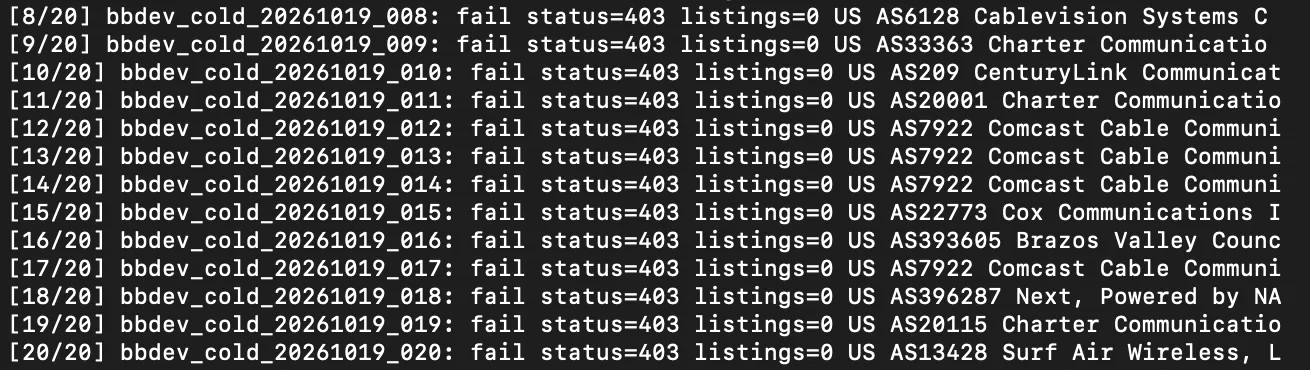
{"proxies": [{"type": "browserbase", "geolocation": {"country": "US"}}]}The exit IPs confirm the proxies engaged. Sessions came out of Charter, Comcast, Verizon, AT&T, Cox, T-Mobile, Mediacom, CenturyLink and several regional ISPs, all US.
- Cold: 0 passes out of 20 runs (13 blocked with a 403, 7 connection errors)
- Warm: 12 passes out of 20 runs (6 blocked with a 403, 2 connection errors), or 12 of 18 completed runs
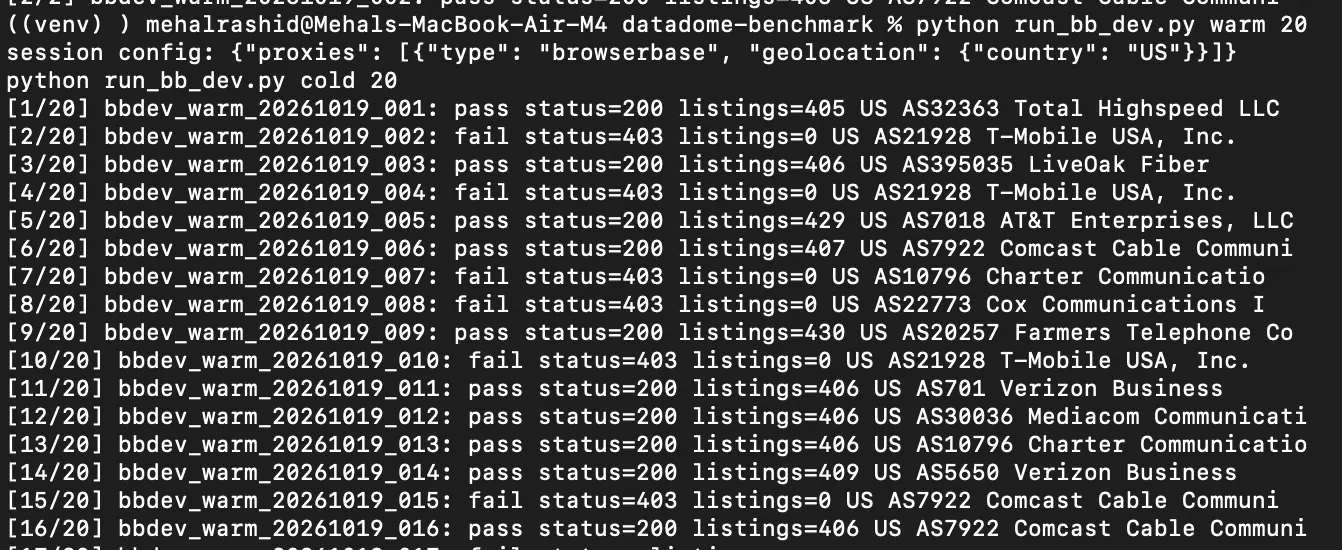
What changed between the two runs
The warm pass rate went down on the paid plan with proxies enabled, not up. Browserbase scored 19 out of 20 on datacenter IPs in September and 12 out of 20 on US residential IPs in October.
That isn’t the direction anyone expects, and the data can’t fully explain it. Two factors stand out.
The first is that three weeks passed between the runs, and DataDome retrains its models per site on a rolling basis. The second is that the residential pool hands out a different ISP on every session, so each run arrives with no history behind that IP, while the datacenter runs came from a narrower and more consistent range.
Either way, it shows that these numbers have a shelf life, and the same configuration can perform differently a few weeks apart.
Run 3: Surfsky Cloud Browser on a US Residential Proxy
Surfsky’s connection method involves making an API call to spin up a one-time browser profile. After that, it’s a CDP connection to the returned WebSocket URL.
We used the Surfsky SDK and pinned every session to a US residential exit with its PremiumProxy object:
async with client.browser(
    fingerprint=Fingerprint(os="mac", os_arch="x86"),
    proxy=PremiumProxy(country="us"),
    browser_settings=BrowserSettings(inactive_kill_timeout=60),
    anti_captcha=AntiCaptcha(enabled=True),
    command_timeout=90,
) as page:
CAPTCHA solving was on, but none of the runs got a CAPTCHA, so it never kicked in.
For every one-time profile, Surfsky generates a fresh set of randomized fingerprints. Cookies or session states aren’t carried over to the next session.
Here’s a fingerprint snapshot of a Surfsky profile:
-
userAgent: matches a modern Chrome build on macOS
-
webdriver: false
-
WebGL renderer and vendor: populated with real-looking values
-
languages:
["en-US", "en"] -
timezone: US-appropriate
-
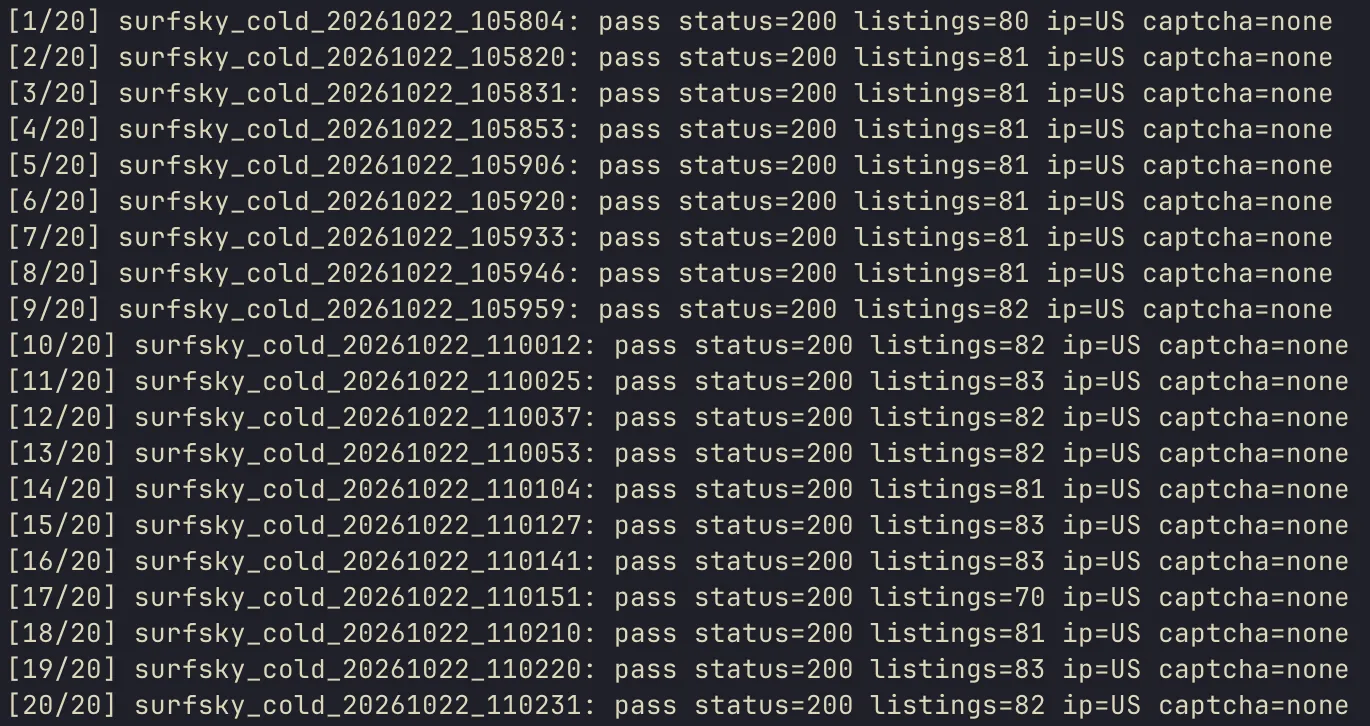
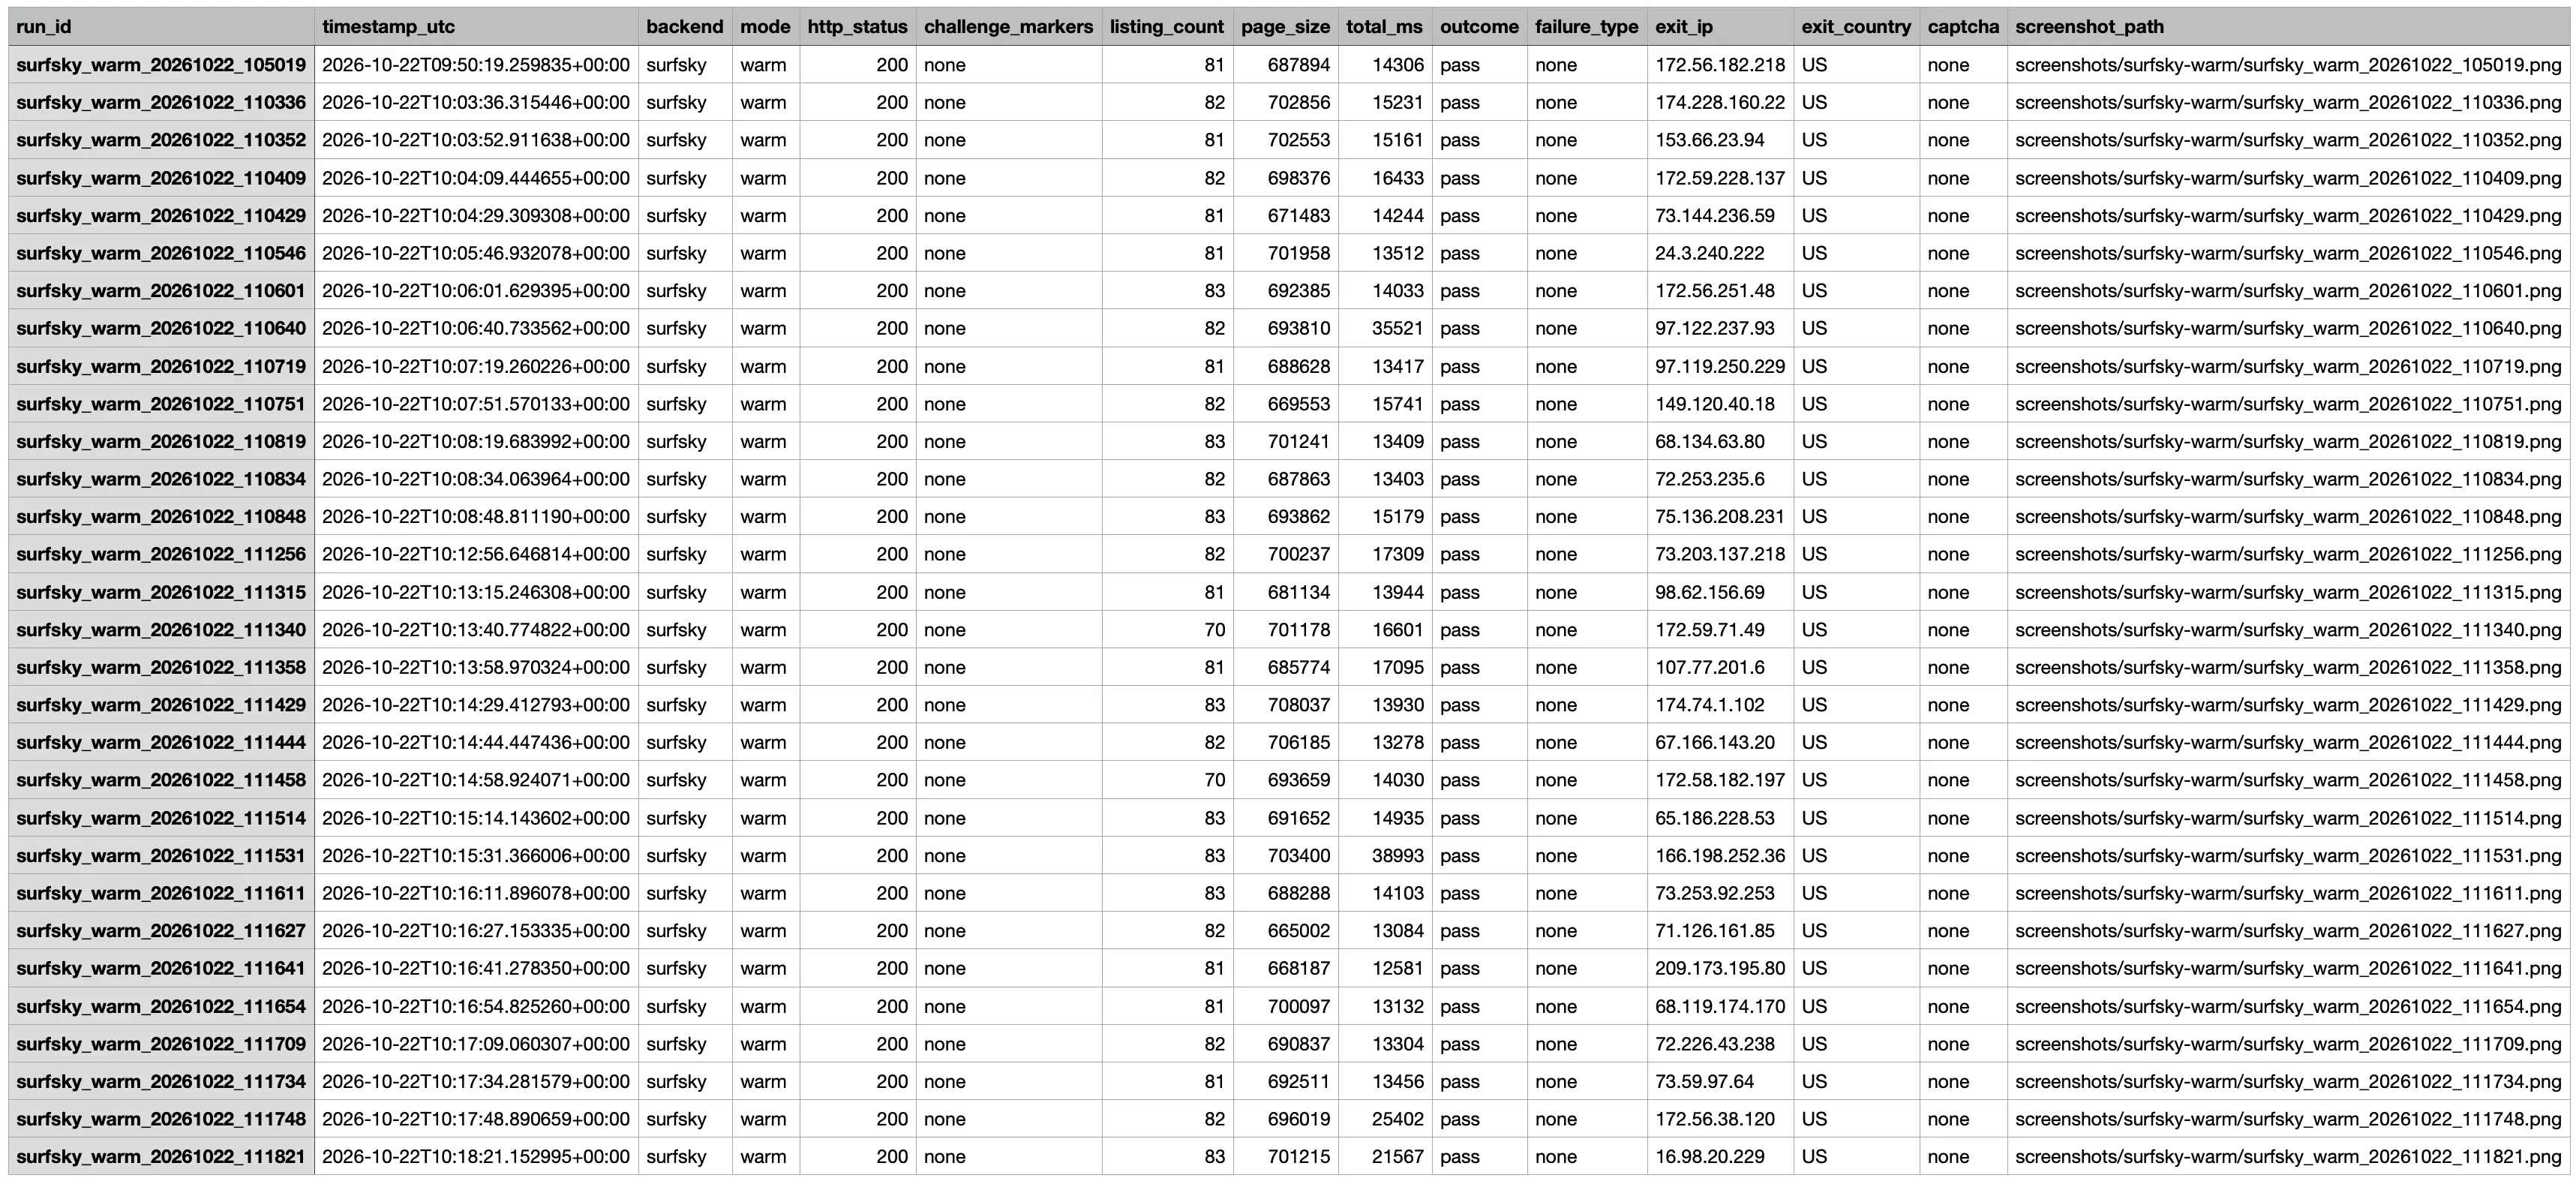
Cold: On cold setup, Surfsky passed 20 out of 20. Every run went straight to the search URL and got a 200, a full results grid and no CAPTCHA. It was the only backend to get through cold.
- Warm: On warm setup, Surfsky passed 20 out of 20.
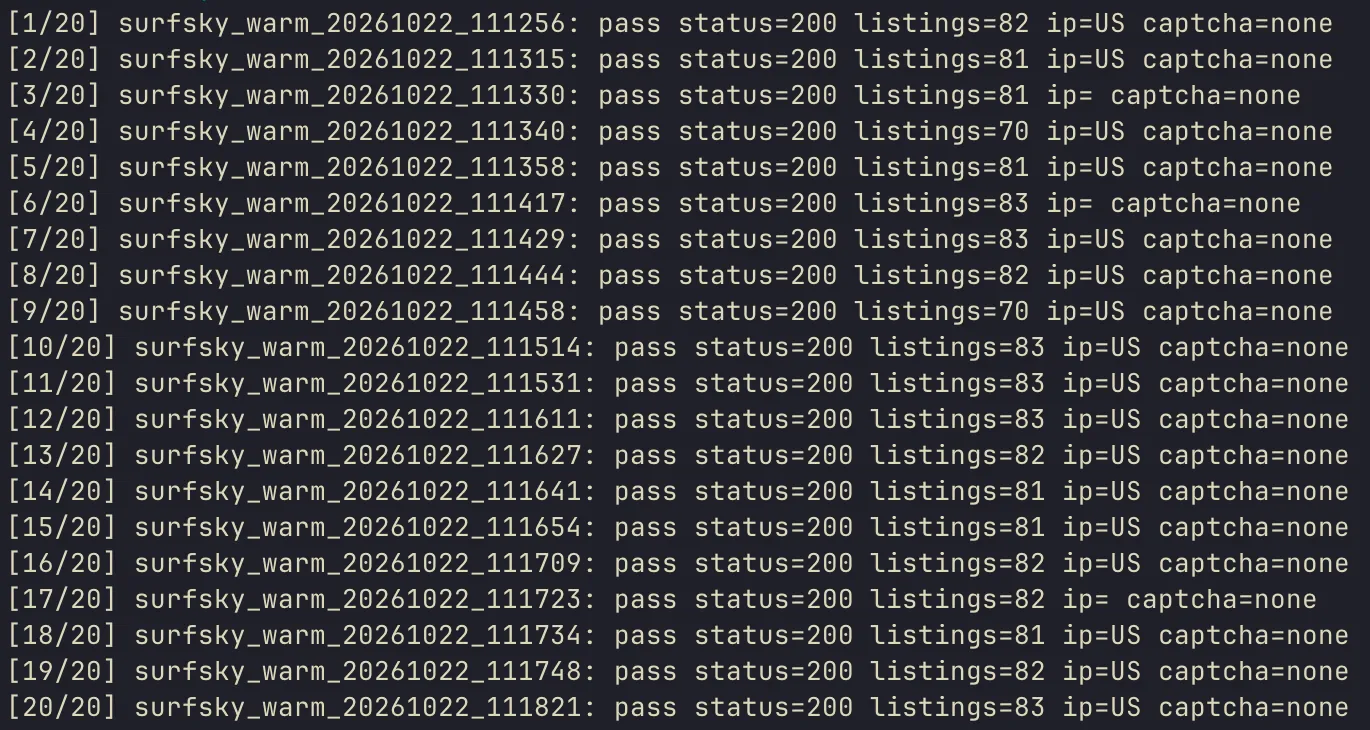
We ran a further 13 warm sessions on Surfsky during setup and validation, outside the 20 logged for this test. All of them passed too, as you can see in the CSV screenshot below.
Speaking of timings, Surfsky was the quicker of the two backends that actually passed.
- Median total run time, cold: 12,446 ms
- Median total run time, warm: 23,142 ms
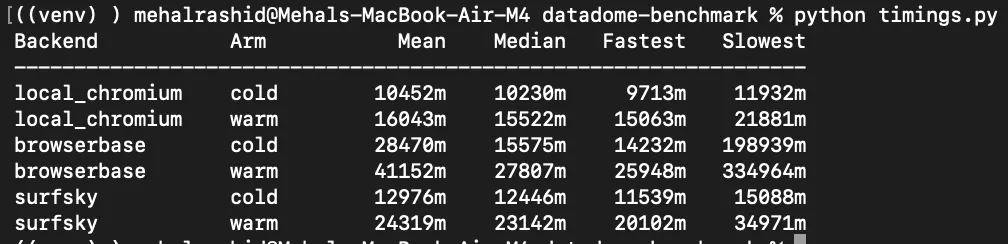
On the warm arm, where both Surfsky and Browserbase were loading real search results pages, Surfsky came in at 23,142 ms against Browserbase’s 27,807 ms.
Of the two backends that passed, Surfsky’s timings were the more consistent, with its slowest run at 34,971 ms against Browserbase’s 334,964 ms.
Results: Pass Rates, Timings and Failure Types
Success rates by backend
All 160 runs, by backend, plan and arm:
| Backend | Plan / config | Date | Arm | Runs | Passed | Pass rate |
|---|---|---|---|---|---|---|
| Local Chromium | US residential proxy | Sep 29-30 / Oct 19 | Cold | 20 | 0 | 0% |
| Local Chromium | US residential proxy | Sep 29-30 | Warm | 20 | 0 | 0% |
| Browserbase | Free, no proxies | Sep 29-30 | Cold | 20 | 0 | 0% |
| Browserbase | Free, no proxies | Sep 29-30 | Warm | 20 | 19 | 95% |
| Browserbase | Developer, US residential | Oct 19 | Cold | 20 | 0 | 0% |
| Browserbase | Developer, US residential | Oct 19 | Warm | 20 | 12 | 60% |
| Surfsky | Trial, US residential | Oct 22 | Cold | 20 | 20 | 100% |
| Surfsky | Trial, US residential | Oct 22 | Warm | 20 | 20 | 100% |
Here are the median times for each backend:
| Backend | Arm | Median total time | Fastest | Slowest |
|---|---|---|---|---|
| Local Chromium | Cold | 10,230 ms | 9,713 ms | 11,932 ms |
| Local Chromium | Warm | 15,522 ms | 15,063 ms | 21,881 ms |
| Browserbase Free | Cold | 15,575 ms | 14,232 ms | 198,939 ms |
| Browserbase Free | Warm | 27,807 ms | 25,948 ms | 334,964 ms |
| Surfsky | Cold | 12,446 ms | 11,539 ms | 15,088 ms |
| Surfsky | Warm | 23,142 ms | 20,102 ms | 34,971 ms |
Warm run times include the homepage load and the 5 second wait before the search navigation, so they aren’t directly comparable to the cold numbers. The comparison that holds is between backends within the same arm.
It’s also worth remembering that a blocked run finishes faster than a successful one, because a block page is a fraction of the size of a real results page. Speed here isn’t a measure of quality. Local Chromium has the fastest times in this table and it didn’t pass a single run.
Where each one failed
Out of 160 runs, 89 failed. Local Chromium and both Browserbase configurations failed every single cold run, and local Chromium also failed every warm run. Surfsky didn’t fail any.
Most of those failures came back as an HTTP 403 with DataDome’s challenge body. This is the block_403 type.
| Failure type | Local cold | Local warm | BB free cold | BB free warm | BB dev cold | BB dev warm | Total |
|---|---|---|---|---|---|---|---|
block_403 |
20 | 20 | 20 | 0 | 13 | 6 | 79 |
connection_error |
0 | 0 | 0 | 1 | 7 | 2 | 10 |
| Total failures | 20 | 20 | 20 | 1 | 20 | 8 | 89 |
In every run that failed with block_403, the response HTML had challenge markers such as geo.captcha-delivery.com and var dd=. There was no listing data in any of them.
The failure pattern points to the session layer rather than the network layer. On cold runs, local Chromium and Browserbase got the same 403 with the same body whether they were on a residential IP or a datacenter IP. For Browserbase, the thing that changed the outcome was session history, not IP type. Surfsky passed with no history at all, so on Etsy the browser itself decided whether a cold visit got blocked.
What This Means If You Need to Bypass DataDome in Production
Landing cold on a search results URL is a signal on its own. All 60 cold runs on local Chromium and Browserbase failed, 53 of them blocked by DataDome, on residential and datacenter IPs alike. Surfsky passed all 20 of its cold runs, so whether that signal gets you blocked depends on the browser underneath.
Warm-up on its own isn’t the answer either. Local Chromium had the same homepage visit and a US residential proxy and still didn’t pass once in 20 attempts.
So if you need to bypass DataDome in production, start with the browser. A warm-up helped Browserbase, it didn’t save local Chromium, and Surfsky passed with or without it.
Keep in mind that DataDome retrains its models and ships updates, so any setup that works today has a shelf life, and it’s the part most people underestimate.
The real question isn’t which setup passes this week. It’s who keeps it passing next quarter.
If that’s going to be you, the maintenance is yours to carry. If you’d rather it wasn’t, a cloud browser like Surfsky patches against those updates as they roll out, and your own code stays the same.
When DataDome Shows a CAPTCHA
Warm-up and a managed browser keep most sessions away from the challenge, but not every one. When DataDome does show a CAPTCHA, Surfsky solves it inside the same session, in either of its two forms:
- Slider: solved by click, with the
datadome_clicktype. - Audio: solved through the audio challenge, with the
datadome_audiotype.
Turn on anti_captcha when you start the browser, then call Captcha.solve with one of these types or let automatic solving pick the challenge up. The DataDome guide has the setup and code.
If DataDome has already banned the IP, no solver helps. Switch the proxy and retry.
Reproduce the DataDome Benchmark
This entire test was based on a single Python harness. All of this is in the repo we published on Github, including the raw result CSVs and the exact versions we used.
Here’s everything that you’ll need to reproduce and run the test yourself:
Prerequisites
pip install playwright surfsky
playwright install chromium
The Surfsky SDK requires Python 3.12 or newer. macOS ships with an older build, so you may need to install a current Python before this will resolve.
Environment setup
Copy .env.example to .env in the project root and fill it in:
# US residential proxy for the local arm
PROXY_SERVER=http://your-proxy-host:port
PROXY_USER=your_proxy_username
PROXY_PASS=your_proxy_password
# Browserbase
BROWSERBASE_API_KEY=your_key_here
BROWSERBASE_PROJECT_ID=your_project_id_here
# Surfsky
SURFSKY_API_KEY=your_key_here
The scripts read plain environment variables, so export the file in your shell before running them:
set -a && source .env && set +aCheck your Browserbase plan first
python scripts/browserbase_plan_probe.pyIt tries each Browserbase session option used in this test and prints which ones your plan accepts and which it rejects.
Dry run
One run per backend and arm, to check your setup before committing to the full set:
python scripts/run_local.py cold 1
python scripts/run_local.py warm 1
python scripts/run_browserbase_dev.py cold 1
python scripts/run_browserbase_dev.py warm 1
python scripts/run_surfsky.py cold 1
python scripts/run_surfsky.py warm 1
Each script prints the outcome, HTTP status, listing count and exit country per run, so you can confirm the proxy is actually engaging before you collect anything.
Full test run
python scripts/run_local.py cold 20
python scripts/run_local.py warm 20
python scripts/run_browserbase_dev.py cold 20
python scripts/run_browserbase_dev.py warm 20
python scripts/run_surfsky.py cold 20
python scripts/run_surfsky.py warm 20
We ran a couple of batches per backend.
Config that has to match exactly
These values are set inline in every scripts/run_*.py. Keep them identical across backends if you want comparable results:
- Target URL:
https://www.etsy.com/search?q=leather+wallet - Warm-up URL:
https://www.etsy.com, followed by a 5 second wait - Navigation:
domcontentloaded, followed by a 6 second wait before reading the page - Listing marker:
data-listing-id - Page timeout: 60 seconds
- Spacing between runs: 45 seconds
We navigate with domcontentloaded and then wait a further 6 seconds before reading the page. That wait is important because DataDome’s device check runs after the initial DOM is ready, so reading too early can catch it mid-challenge.
The pass check also requires listing content in the HTML, not just a 200. A DataDome block page is around 1,500 bytes and contains no listings, so it can’t be mistaken for a successful load no matter when you read it.
CSV schema
Every script writes these columns:
run_id, timestamp_utc, backend, mode, http_status, challenge_markers, listing_count, page_size, total_ms, outcome, failure_type, exit_ip, exit_country, screenshot_pathThe local script adds exit_city, the Browserbase scripts add session_id, and the Developer plan script also adds plan and exit_org.
Failure type reference
A failed run gets one of these in failure_type:
| String | Meaning |
|---|---|
block_403 |
HTTP 403 with DataDome challenge body |
challenge_200 |
HTTP 200 but DataDome markers present in body |
empty_dom |
200 returned but listing selector absent |
connection_error |
The session, proxy or page failed or timed out |